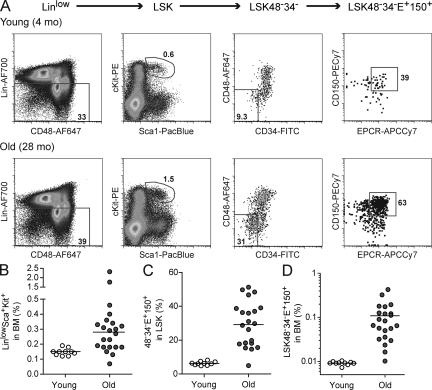
Figure 1.
The frequency of BM cells with HSC markers increases with age but is highly variable between individual old mice. (A) Representative FACS profiles of BM from young and old mice. BM from a young (4 mo) and an old (28 mo) mouse was collected and stained with antibodies specific for HSC markers as described in Materials and methods. Equal numbers of events (4.5 × 10⁵) are shown for each mouse. Viable cells were first selected based on their forward and side scatter properties and their exclusion of propidium iodide. Lineage-low (Linlo) cells were then selected as shown in the leftmost panel, followed by gating for cells double positive for Sca1 and cKit to identify the LSK population. The LSK population was enriched further by selecting those cells negative for CD34 and CD48 and positive for EPCR (E+) and CD150 to obtain the stem cell–enriched LSK48−34−E+150+ population. (B and C) Percentage of LinloSca1+cKit+ (LSK) in BM and percentage of CD48−CD34−EPCR+CD150+ within the LSK population of 10 individual young (4–5 mo) and 22 old (24–28 mo) mice. Dots represent individual mice, and horizontal lines indicate median values. (D) Mean BM frequencies of LSK48−34−E+150+ cells in the same 10 young and 22 old mice.

