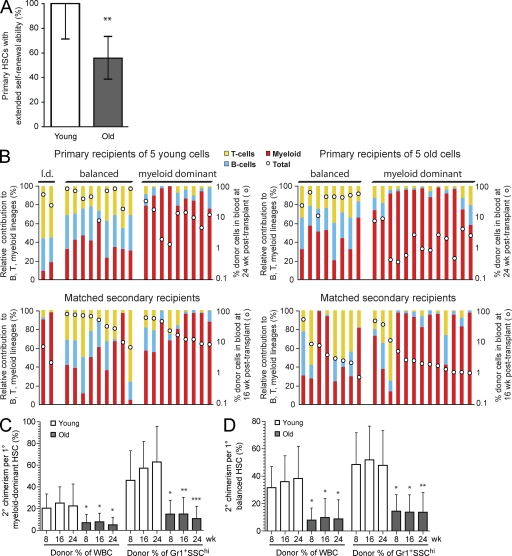
Figure 5.
Old HSCs exhibit decreased self-renewal activity and smaller secondary clone size when measured by secondary transplantation in vivo. (A) After correcting for the differences in primary HSC frequencies, the proportion of primary HSCs with extensive in vivo self-renewal activity was calculated based on the secondary transplantation results shown in Table I. **, P < 0.01 for corrected proportions (Fishers exact test). Error bars represent corrected 95% confidence interval for original proportions. (B) All positive W41 secondary recipients and their corresponding primary recipients are shown. Colored bars and white dots represent relative donor lineage contribution and absolute donor proportion in the blood, as described for Fig. 3 C. Top panels show individual primary recipients, grouped by relative lineage contribution pattern as in Fig. 3 C. Bottom panels show the positive secondary recipients, arranged so that corresponding primary and secondary recipients are aligned vertically. l.d., lymphoid dominant. (C and D) The mean contribution to total peripheral blood or to the granulocyte lineage in secondary (2°) W41 recipients was calculated per primary (1°) young myeloid-dominant (n = 9), young balanced (n = 9), old myeloid-dominant (n = 13), or old balanced (n = 8) HSC by dividing by the mean number of functional HSCs injected per positive primary recipient (1.79 HSCs per positive young recipient and 1.33 HSCs per positive old recipient). Time is shown as weeks after transplant. Error bars represent 95% confidence intervals. *, P < 0.05; **, P < 0.01; ***, P < 0.001, Mann-Whitney U test.

