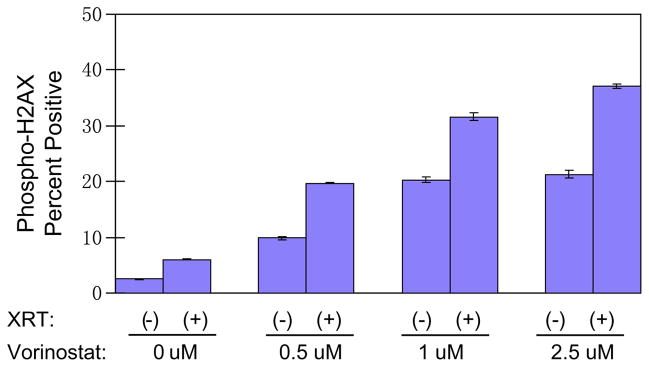
Fig. 4.
γ-H2AX expression levels after vorinostat and radiation (XRT) treatment measured by flow cytometric analysis of NB1691luc cells. Cells were incubated with vorinostat at (0.5 μM, 1 μM, or 2.5 μM) for 24 h and irradiated with 2 Gy 24 h later. Cells were harvested 6 h after radiation. Percent of cells positive for γ-H2AX staining is shown on the y-axis.

