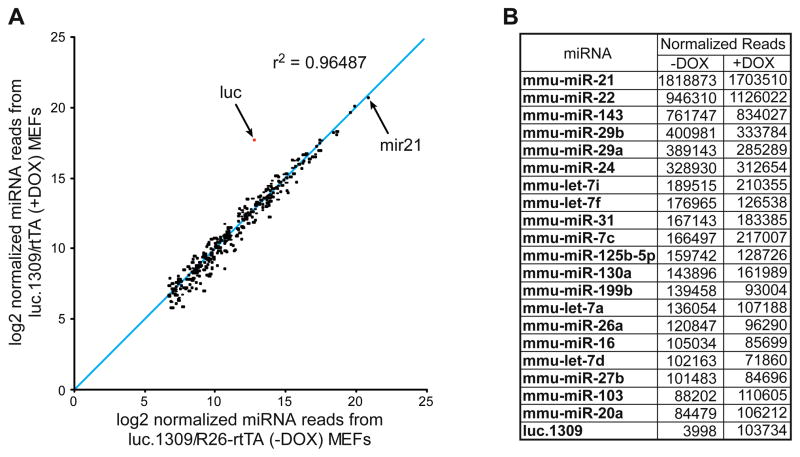
Figure 3. Endogenous miRNA levels are unaffected by exogenous shRNA induction.
(A) Scatter plot representing the normalized expression of the 319 most abundant miRNAs from DOX-treated and untreated TG-luc.1309/R26-rtTA MEFs. R2 correlation coefficient excludes TG-luc.1309 sequence reads.
(B) Number of normalized reads obtained for the top 20 miRNAs and luc.1309 expressed in MEFs.
See also Figure S3.

