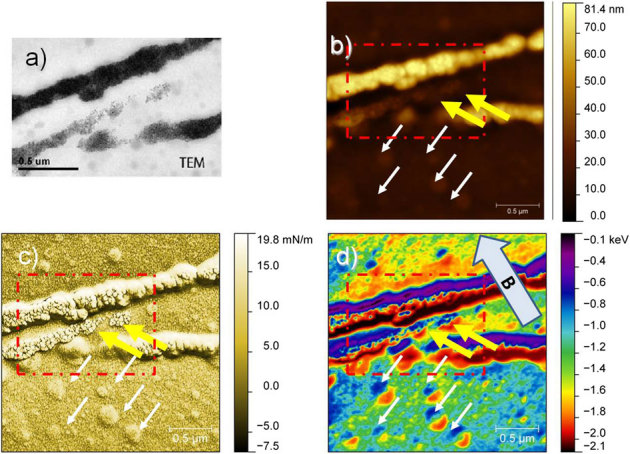
Figure 5. Magnetic particle stripes inside the polymer matrix, examined with (a) TEM and (b) AFM.

(c) and (d) represent the force gradient and the energy loss images. The red dashed square in b-d corresponds to TEM image. The yellow arrows indicate bare magnetic structures at the surface, exposed by the ultramicrotome cut and magnetic structures embedded in the polymer, both hardly visible in surface topography, but clearly revealed by the TEM measurement.
