Figure 2.

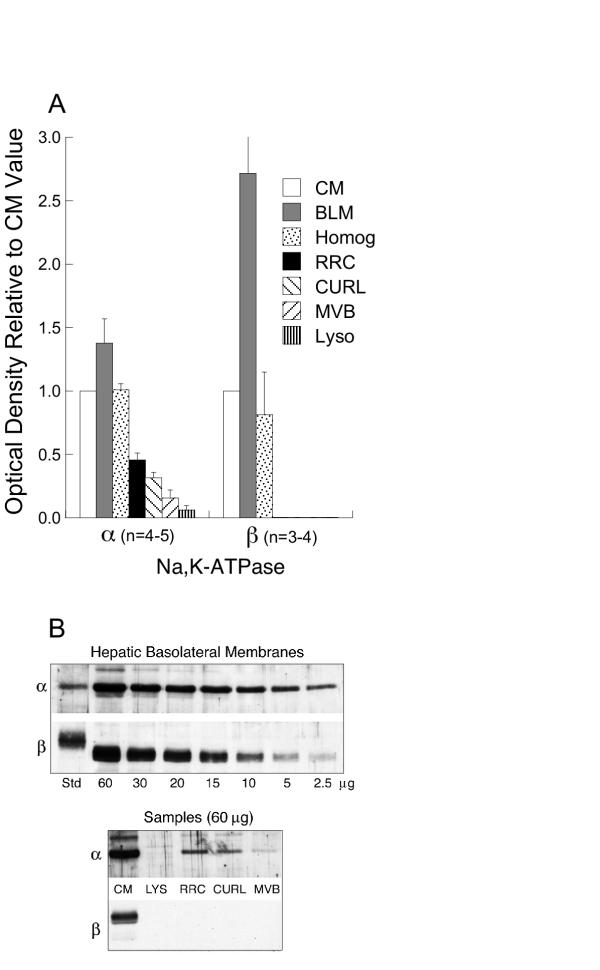
Na, K-ATPase as membrane marker. A) Quantitative distribution of α1 and β1 subunits of Na, K-ATPase in different cell fractions: CM (white bars), BLM (gray bars), liver homogenate (dotted bars), RRC (black bars), CURL (down slashed bars), MVB (up slashed bars) and lysosomes (stripped bars). Optical densities were normalized to values in CM as in Figure 1. Bars represent the mean ± SEM of results from "n" different preparations of each cell fraction, as indicated on the figure. Both subunits were disenriched in endocytic vesicles and lysosomes compared to CM (p < 0.0001). B) Upper blot: detection of α1 and β1 subunits in BLM over a wide range (2.5–60 μg) of protein/lane. Lower blot: representative Western blot illustrating data summarized in (A) with 60 μg protein/lane.
