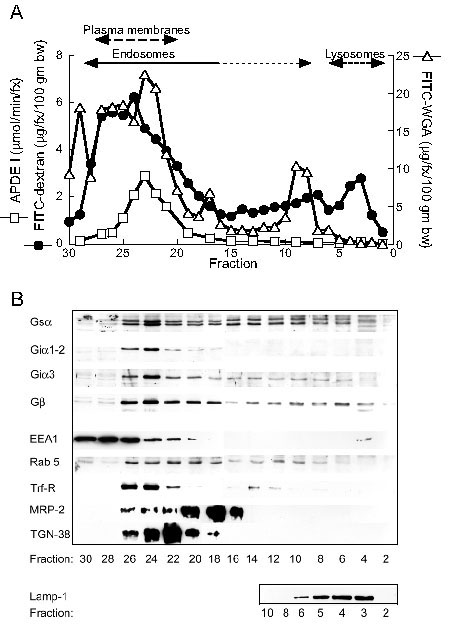
Figure 4.

Distribution of G proteins on Percoll gradients. A) Distribution of endocytosed FITC-dextran (closed circles), BLM-bound FITC-WGA (open triangles) and the plasma membrane marker alkaline phosphodiesterase 1 (APDE 1) (open squares) on Percoll gradients. The predominant positions of plasma membranes, endosomes and lysosomes are indicated at the top of the graph. The data for the dextran and APDE 1 curves were previously published [ref [17], Figure 3C]. Reprinted from Hepatology 32, Van Dyke RW, Effect of cholera toxin and cyclic adenosine monophosphate on fluid phase endocytosis, distribution and trafficking of endosomes in rat liver, pp. 1357–1369, 2000 with permission from The American Association for the Study of Liver Disease. B) Distribution of Gsα, Giα1,2, Giα3 and Gβ and various marker proteins on Percoll gradients. Blots for heterotrimeric G protein subunits contained 20 μg protein/lane and are representative of similar blots for 4 different liver preparations. Blots for EEA1, rab 5, Trf-R, MRP-2, TGN-38 and LAMP1 contained 40, 20, 20, 30, 30 and 15 μg protein/lane, respectively, and are representative of similar blots for 4,4,4,4,3 and 4 different liver preparations, respectively.
