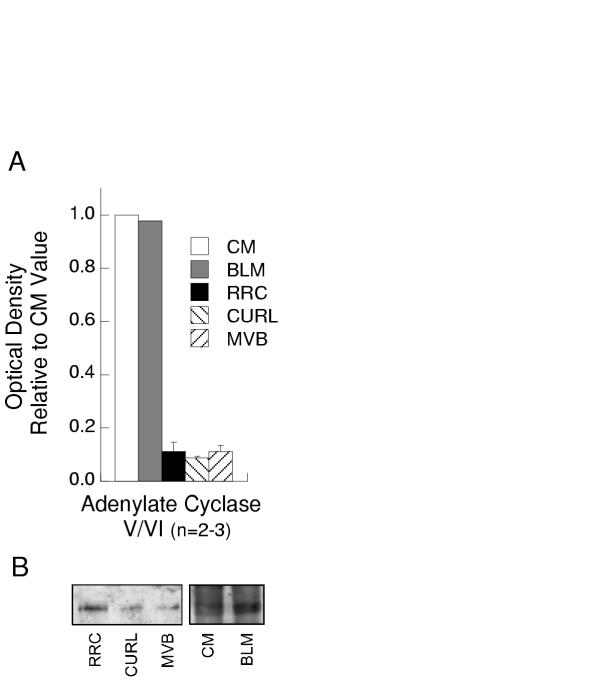
Figure 5.

Adenylate cyclase on endosomes. A) Quantitative distribution of AC in different cell fractions: CM (white bars), BLM (gray bars), RRC (black bars), CURL (down slashed bars) and MVB (up slashed bars). Optical densities were normalized to values for CM as in Figure 1. Bars represent mean ± SEM of results from 2 different preparations of BLM and 3 preparations each of RRC, CURL and MVB. RRC, CURL and MVB exhibited significantly less AC compared to CM (p ≤ 0.0003). B) Representative Western blots showing detection of AC in CM and BLM (30 μg protein/lane) and in purified endocytic vesicles (60 μg protein/lane).
