
Figure 6.
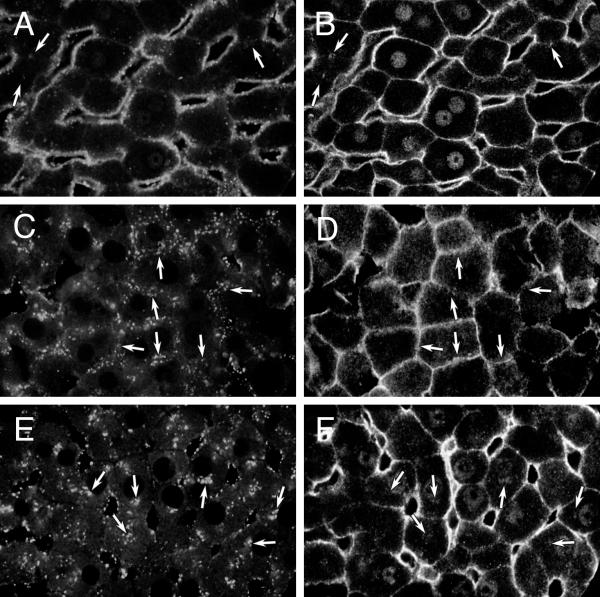
Gsα on endosomes. Confocal microscopy of rat liver sections showing distribution of endocytosed Texas red-dextran (A, C, E) and Gsα (B, D, F) in the same, respective, images. A, B: Control liver exposed to dextran for 2 minutes. Arrows point to punctate Gsα staining in the pericanalicular area (B) and region where faint punctate autofluorescence was visible(A). C, D: Control liver exposed to dextran for 20 minutes. Arrows point to punctate Gsα staining in the pericanalicular area (D) and corresponding endocytosed Texas red-dextran (C). E, F: CTX-treated liver exposed to dextran for 20 minutes. Arrows point to punctate Gsα staining in the perinuclear area (F) and corresponding endocytosed Texas red-dextran (E). All images were obtained with anti-fluorescein Alexa 488 amplification of signal and are representative of 16 (A, B), 54 (C, D) and 56 (E, F) images examined from 1, 6 and 6 livers, respectively.