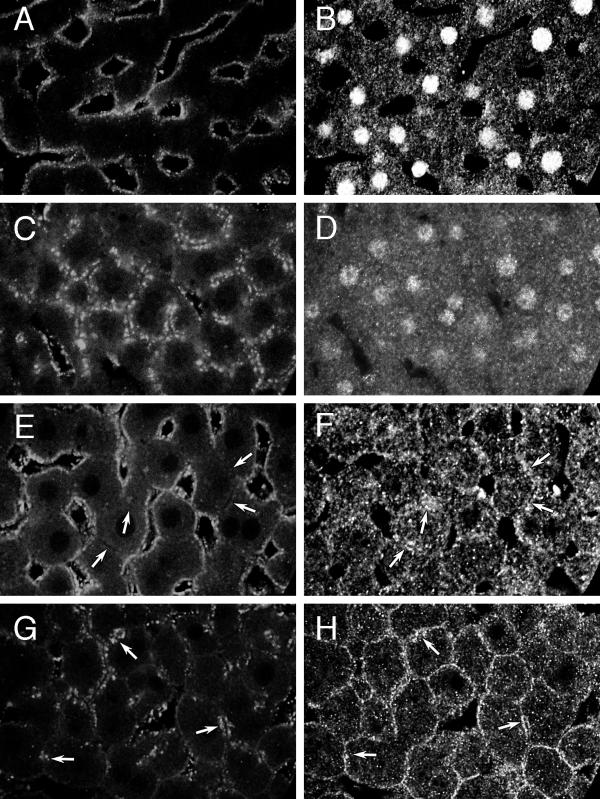
Figure 7.

Giα1,2 and Giα3 on endosomes. Confocal microscopy of rat liver sections showing distribution of endocytosed Texas red-dextran (A, C, E, G) and Giα1,2 (B, D) or Giα3 (F, H). Giα1,2: A, B: Control liver exposed to dextran for 2 minutes. C, D: Control liver exposed to dextran for 20 minutes. Giα3: E, F: Control liver exposed to dextran for 2 minutes. G, H: Control liver exposed to dextran for 20 minutes. Arrows point to punctate Giα3 staining in the pericanalicular area (F, H) and region of punctate autofluorescence (E) or corresponding endocytosed Texas red-dextran (G). Images D and H were obtained with anti-fluorescein Alexa 488 amplification of signal. Images A-H are representative of 17 (A, B), 52 (C, D), 11 (E, F) and 50 (G, H) images examined from 1, 7, 1 and 7 different livers, respectively.
