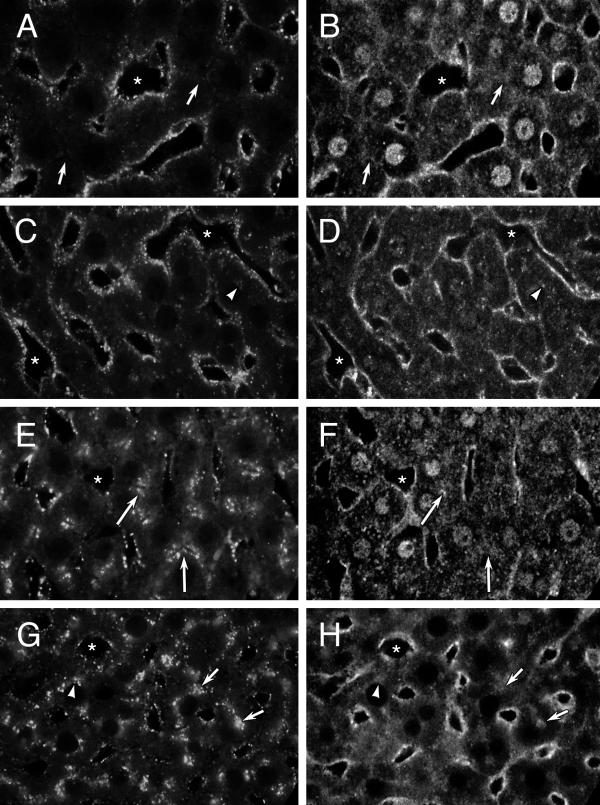
Figure 8.

Gβ on endosomes. Confocal microscopy of rat liver sections showing distribution of endocytosed Texas red-dextran (A, C, E, G) and Gβ (B, D, F, H) in the same image. A, B: Control liver exposed to dextran for 2 minutes. C, D: CTX-treated liver exposed to dextran for 2 minutes. E, F: Control liver exposed to dextran for 20 minutes G, H: CTX-treated liver exposed to dextran for 20 minutes. Arrows point to punctate Gβ staining in the pericanalicular area (B, F, H) and region of punctate autofluorescence (A) or corresponding endocytosed Texas red-dextran (E, G), arrowheads point to punctate Gβ staining in the perinuclear area in CTX-treated livers (D, H) and region of punctate autofluorescence (C) or corresponding endocytosed Texas red-dextran (G) and asterisks mark representative sinusoidal spaces. Images are representative of 10 (A, B), 30 (C, D), 36 (E, F) and 39 (G, H) images examined from 1, 1, 5 and 4 livers, respectively.
