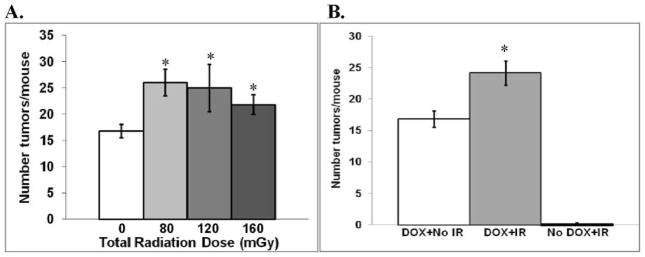
FIG. 3.
Tumor formation with and without CT irradiation. Panel A: Mean number (± SEM) of lung tumors/mouse for each total dose level. There was a significant radiation effect that was independent of dose. *P < 0.05 compared to unirradiated mice expressing the Ki-rasG12C gene. Panel B: Comparison of the mean number of lung tumors/mouse for the combined data for irradiated mice. IR = ionizing radiation. White bar: unirradiated mice expressing the Ki-rasG12C gene; gray bar: irradiated mice expressing the Ki-rasG12C gene. *P = 0.01 compared to unirradiated mice expressing the Ki-rasG12C gene. Black bar: irradiated mice not expressing the Ki-rasG12C gene.

