
Figure 12.
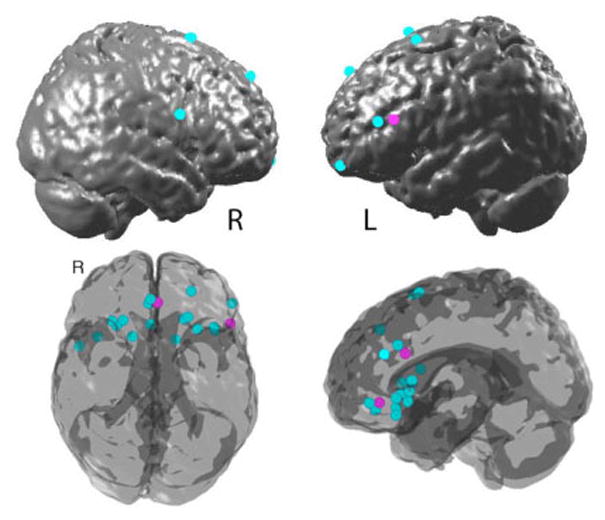
Coordinates identified in Table 2 as correlated with deactivations in the amygdala during emotion regulation plotted on the surface of a template brain (top left and right) and rendered on a glass brain (bottom view and left view). The cyan markers are coordinates reported in studies of reappraisal. The maroon markers are coordinates reported in studies using recall of positive or soothing memories or images to regulate anxiety or sadness. The rendering was made with StudyplotUtility (http://psych.colorado.edu/~tor/) written by Tor Wager. GingerAle (http://brainmap.org/ale/index.html) was used to transform MNI coordinates into Talairach space.