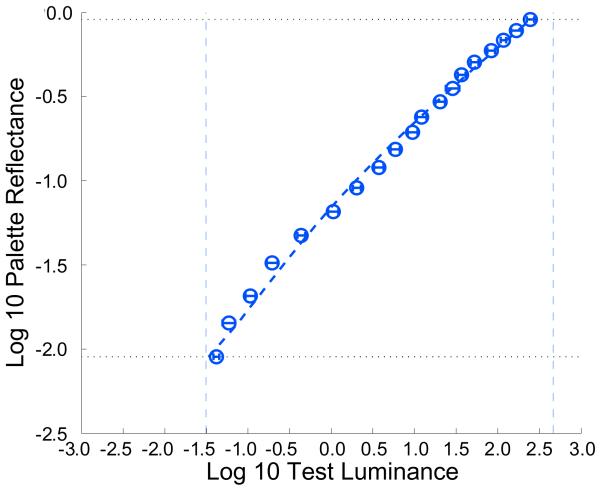
Figure 2. Luminance-to-lightness mapping shows high compression.
Palette log 10 reflectance plotted against test log 10 luminance (cd/m2) for Experiment 1. Open circles plot the average test luminance for which that paper was chosen as a match, averaged across observers (N=8), error bars indicate +/− 1 between-observers standard error of the mean (SEM). Dashed vertical lines show upper and lower limits of contextual/test luminances. Dotted horizontal lines show the minimum and maximum palette paper reflectance. The line through the data shows the fit of the model described in the text. Figure S1 shows that similar results are obtained when a standard Munsell palette (N2.0/ to N 9.5/) is used.

