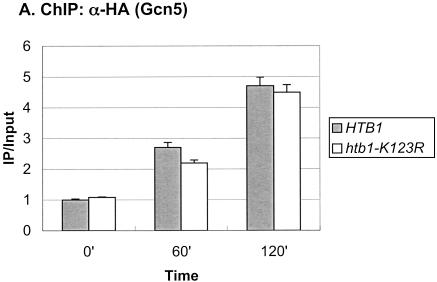
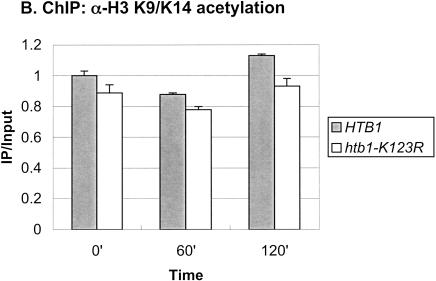
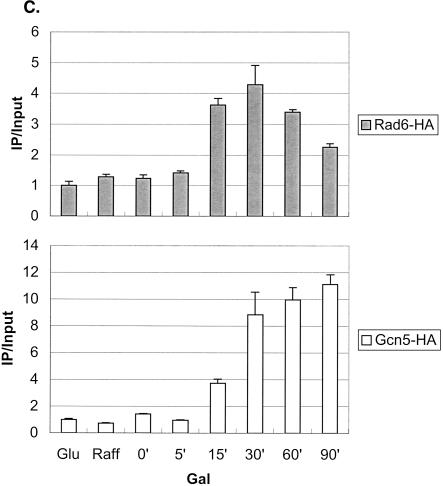
Figure 3.
Rad6 and SAGA show different patterns of association with the GAL1 promoter. (A) Strains carrying Gcn5-HA and either HTB1 (YKH012) or htb1-K123R (YKH019) were subjected to ChIP and PCR analysis in real time as described in the legend to Figure 1A before and after a shift to YP + galactose medium. (B) ChIP was performed with anti-H3 K9/K14 acetylation antibodies in strains Y131 (HTB1) and Y133 (htb1-K123R) before and after a shift to YP + galactose medium, and the DNA was analyzed by PCR in real time to determine the levels of H3 acetylation at the GAL1 core promoter. (C) ChIP was performed with anti-HA antibodies in strains YKH010 (Rad6-HA HTB1) and YKH0112 (Gcn5-HA HTB1) during growth in YPD (Glu), after 2 h in YP + 2% raffinose (Raff), and at the indicated times after galactose was added to a final concentration of 2%. PCR in real time was performed to measure the association of Rad6 and Gcn5 with the GAL1 UAS. The data in each panel were normalized to the IP/Input ratio of the INT-V control sequences.


