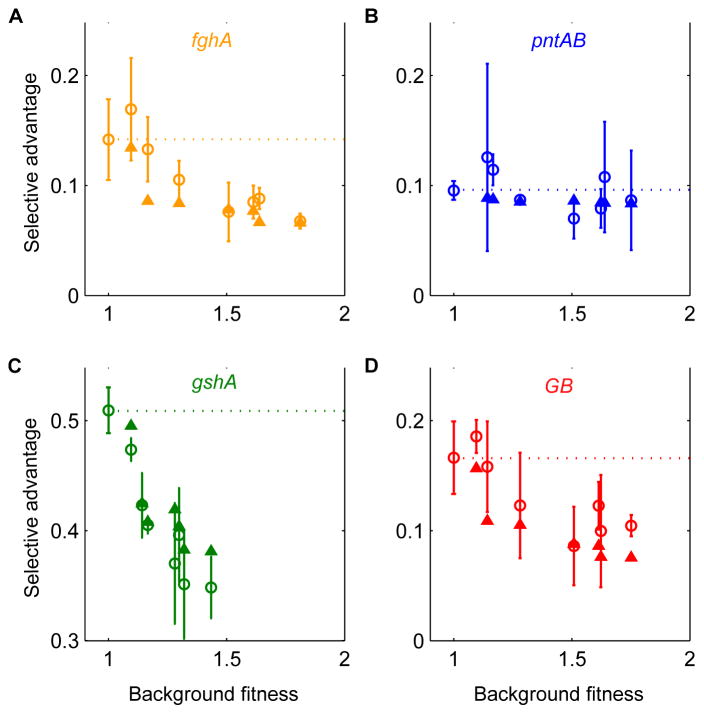
Figure 3.
Antagonistic trend of epistasis detected from the data captured by the benefit-cost model. (A–D) Plots of measured (open circles) and predicted (solid triangles) selective coefficients s for each of the four evolved alleles, respectively, versus the fitness of the background onto which the allele was introduced. Dashed lines indicate selective advantages for each allele on the ancestral background (i.e., expectation for no epistasis: Wij = λiλjWo).

