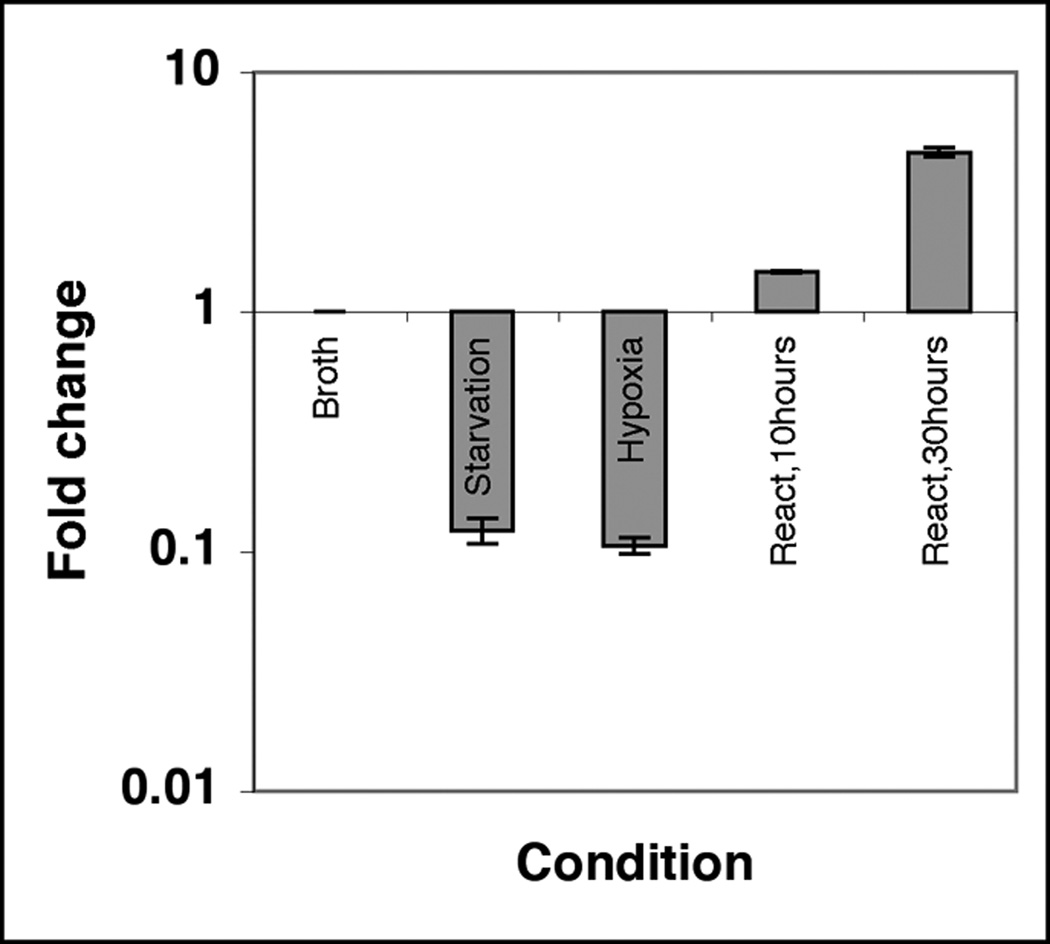
Figure 1.

Expression levels of ftsZ under different growth conditions. M. tuberculosis was grown in broth under various indicated conditions as described. RNA was extracted and levels of ftsZ mRNA were measured by quantitative real-time PCR using Taqman chemistry (see Table 1). The expression levels of ftsZ mRNA were normalized to 16s mRNA levels. Mean ±SD from three independent experiments are shown.
