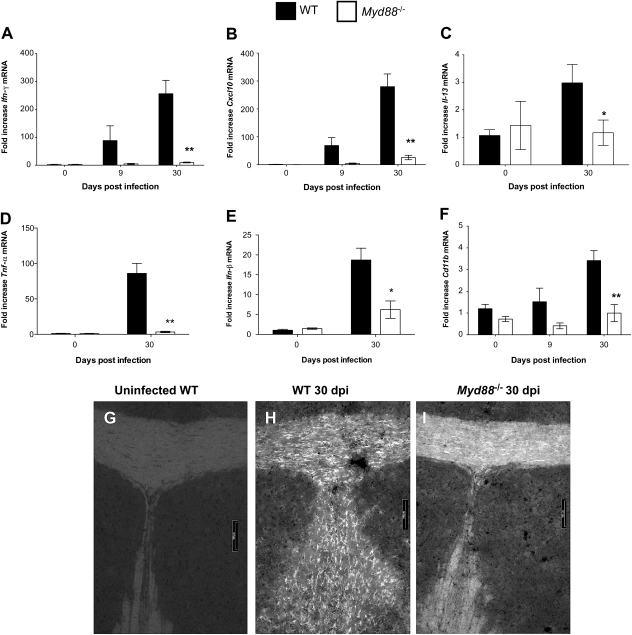
Figure 2.
Levels of Ifn-γ, Cxcl-10, Il-13, Tnf-α, Ifn-β, and Cd11b messenger RNA (mRNA) and microglia activation in Trypanosoma brucei brucei–infected wild-type (WT) and Myd88−/− mice. A–F, Relative expression of Ifn-γ (A), Cxcl-10 (B), Il-13 (C), Tnf-α (D), Ifn-β (E), and Cd11b (F) mRNA in the brains of uninfected or infected WT and Myd88−/− mice. All values are normalized with respect to Hprt mRNA levels. Each bar represents mean ± standard error of measurement (SEM) of the values obtained from 4 animals. *P < .05; **P < .01 (unpaired t test; significant differences between WT and Myd88−/− mice killed at same postinfection time point). G–I, Activated microglia (as detected by Iba-1 immunostaining) in the corpus callosum of WT (G, H) or Myd88−/− (I) mice before infection (G) or 30 days after infection (H, I). Robust staining of microglia is observed in the corpus callosum of infected WT mice (H) (scale bar, 100 μm).

