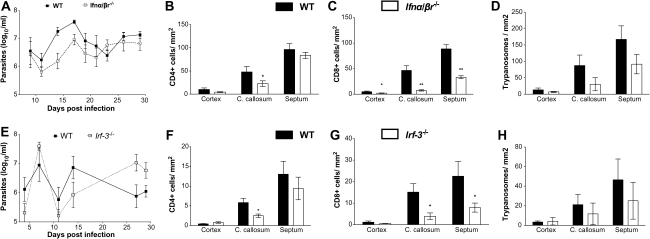
Figure 5.
Role of interferon (IFN) α/β and IRF3 in T-cell and parasite infiltration in the brains of Trypanosoma brucei brucei–infected mice. A, levels of parasitemia in infected wild-type (WT) and Ifn-α/β r−/− mice. Each point represents the mean log10 parasites per milliliter ± standard error of measurement (SEM) obtained from 5 or 6 animals per group. B–D, Mean numbers (± SEM) of CD4+ (B) and CD8+ (C) T cells and T. brucei brucei (D) per square millimeter in the cortex, corpus callosum (C. callosum), and septal nuclei of infected WT and Ifn-α/β r−/− mice at 30 days post infection (5 or 6 animals per group). *P < .05, **P < .01 (unpaired t test; significantly different from WT mice). E, Levels of parasitemia in infected WT and Irf3−/− mice. Each point represents the mean log10 parasites per milliliter (± SEM) obtained from 6 animals per group. F–H, Mean numbers (± SEM) of CD4+ (F) and CD8+ (G) T cells and T. brucei brucei (H) per square millimeter in the cerebral cortex, corpus callosum, and septal nuclei of infected WT and Irf3−/− mice at 30 days post infection (4–6 animals per group). *P < .05 (unpaired t test; significantly different from WT mice).

