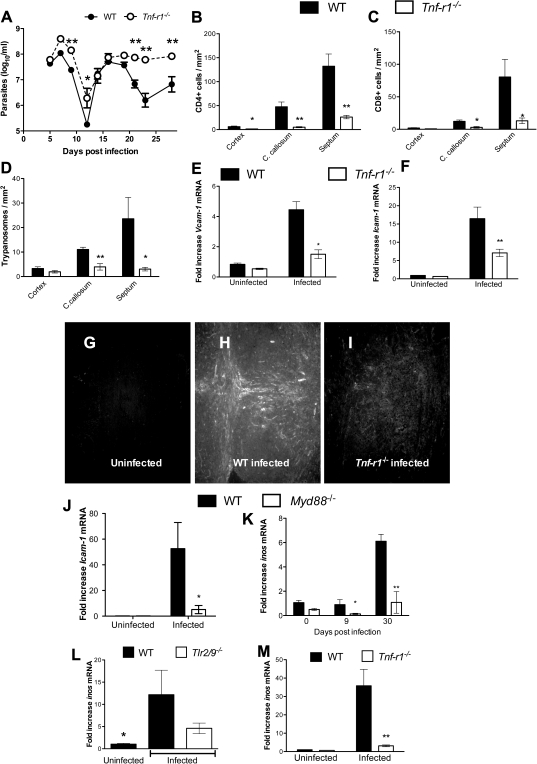
Figure 6.
Tumor necrosis factor (TNF) α mediates T-cell densities in the brains of Trypanosoma brucei brucei–infected mice. A, Levels of parasitemia in infected wild-type (WT) and Tnfr1−/− mice. Each point represents the mean log10 parasites per milliliter ± standard error of measurement (SEM) obtained from 6 animals per group. *P < .05, **P < .01 (analysis of variance; significantly different from infected WT animals). B–D, Mean numbers (± SEM) of CD4+ (B) and CD8+ (C) T cells and T. brucei brucei (D) per square millimeter in the cerebral cortex, corpus callosum (C. callosum), and septal nuclei of infected Tnfr1−/− and WT mice at 27 days post infection (5 animals per group). *P < .05, **P < .01 (Student t test; significantly different from WT mice at same postinfection time point). E–F, J, Relative expression of Icam-1 (E, J) and Vcam-1 (F) messenger RNA (mRNA) in the brains of Tnfr1 (E, F), Myd88−/− (J), or WT mice at 27 days (Tnfr1−/−) or 30 days (Myd88−/−) post infection. Each bar represents mean ± SEM of the values obtained from 5 animals. *P < .5, **P < .01 (unpaired t test; significantly different from WT group at same time point). G–I, ICAM-1 staining in the corpus callosum and septum of WT (G, H) and TNF R1−/− (I) mice before (G) or 27 days after (H, I) infection. In infected WT mice, robust staining of endothelial cells with ICAM-1 is observed (H) in the corpus callosum and septum. ICAM-1–labeled cells could be observed in brains from T. brucei brucei–infected Tnfr1−/− mice but not from uninfected controls. K–M, Relative expression of Inos mRNA in the brains of Myd88−/− (K), Tlr2/9−/− (L), and Tnfr1−/− (M) and WT mice 27 days after infection with T. brucei brucei. K, M, *P < .05 (unpaired t test; significantly different from WT mice at same postinfection time point). L, *P < .05 (unpaired t test; significantly different from infected WT mice).

