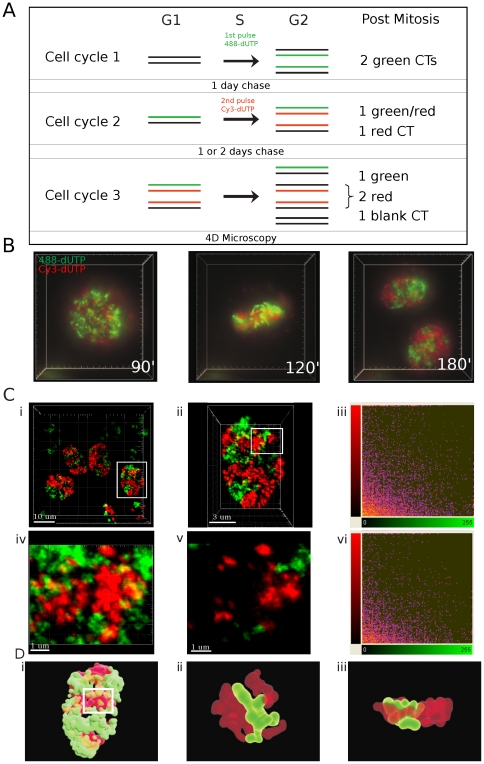
Figure 1. DNA foci are discrete higher-order chromatin structures.
DNA foci within HeLa cells were labelled in two consecutive cell cycles - using AF488-dUTP in the first cycle and Cy3-dUTP in the second – and grown for a further 1–2 days to resolve the labeled DNA foci into uniquely labeled nuclear domains (A). In this context, the domains represent clusters of CTs as individual CTs cannot be resolved with confidence. Labeled cells were analyzed using 3-D time-lapse microscopy (DeltaVision) for up to 24 h (B; time-lapse frames are taken from Supplementary video S1), to confirm that chromosome in mitosis are labeled with either the red or green fluorescent precursor. Cells like those shown (B) were also fixed and imaged (Zeiss LSM510META) without further processing (C). For image analysis, cells with similar intensities in the two imaging channels were manually selected (Ci - white box), confocal Z stacks collected and 3-D projections generated (Cii). Nuclei like that shown in Cii were used for co-localization analysis, using all voxels within the image (Ciii). For this example, co-localization analysis using Imaris software (Ciii), gave a Pearson's coefficient (−0.0194) consistent with very weak co-localization. The region highlighted in Cii (white box) contained the majority of voxels containing signal from the red and green channels and was selected for further analysis. A high magnification view of the cropped region shows the local structure of chromatin domains, both in the entire Z series (Civ) or individual sections (Cv), with discrete patches of red and green labeling and little mixing (yellow) of signal from the two channels. Co-localization analysis using Imaris software without background adjustment (Cvi) showed this typical sample to have a Pearson's coefficient of −0.0437. A surface rendered video simulation of chromatin domains in the cell from Cii was also generated to show the distribution of interaction interfaces within the sample (D; see Supplementary video S2 to section though the 3-D reconstruction). High-power views of the 3-D region highlighted (white box in Di) are shown (Dii–iii). This modeling demonstrates the complex structure of interaction surfaces, with many surface protrusions from one chromatin domain interdigitating with folds or channels within the neighboring domain. Two snap-shots from the 3-D reconstruction (Supplementary video S3) are shown. Scale bars of 10, 3 or 1 µm are shown on individual panels.

