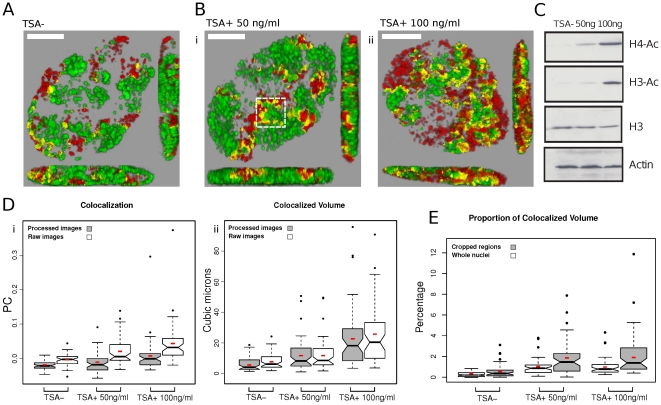
Figure 2. Chromatin epi-states define foci structure.
AF488- and Cy3-dUTP were incorporated into DNA foci are described in the legend to Figure 1. Prior to imaging, cells were treated with TSA (24 h) at the concentrations shown (A–E). For imaging, samples were fixed and confocal Z series collected (Zeiss LSM710) and processed (A–B); imaging was performed on double-labeled nuclei but without selection for labeling intensity. Changes seen in the structure of DNA foci following treatment with TSA (Bi–ii) correlated with changes in global histone acetylation by Western Blot analysis using specific antibodies to pan-Ac+ histones H3 and H4 (C). Image processing of the confocal projections (n = 50 per sample) was performed using Fiji and jacop software. Analysis was perform on raw images, without processing, and on the same images after processing as describe in the legend to Figure 1 (D). As seen in Figure 1, untreated cells (A) gave a negative Pearson's coefficent (Di) consistent with low levels of colocalization in the sample. Following TSA treatment (B), a significant increase in Pearson's coefficient was recorded, demonstrating increased co-localization (Di). In order to develop quantitative estimate of channel co-localization, voxel-level channel intensities were extracted and the volume (µm3) of co-localized voxels calculated (Dii). Finally, the co-localized volumes were calculated as a proportion (%) of the total nuclear volume (whole nuclei) and the volume of the most highly labeled regions (cropped regions – the boxed region in Bi shows a typical example) of individual nuclei (E; Table 2). Small red boxes on the box plots represent the mean value for each distribution. Scale bars of 5 µm are shown on individual panels.

