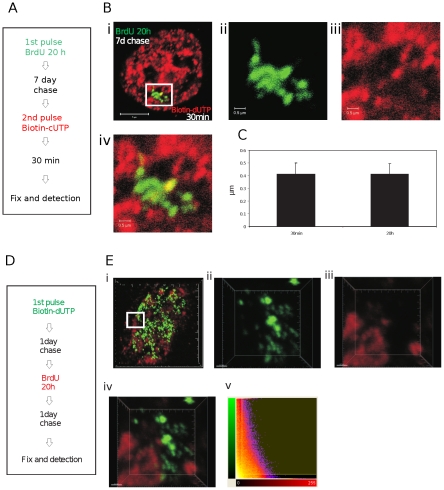
Figure 4. Estimating global levels of chromatin mixing.
Pulse-labeling with conjugated replication precursors such as Cy3- or biotin-dUTP yields labeled DNA foci in which only about 15% of DNA contains the modified precursor. As we are able to measure DNA mixing at the boundaries of such foci in highly labeled nuclear volumes, it is important to know if apparent volumes of foci are influenced by the extent of modified precursor incorporation. HeLa cells were labeled as shown (A) and processed by indirect immuno-labeling. Confocal projection of double-labeled cells like that shown (B) were collected and the diameters of foci measured (C) using Imaris software in selected regions as shown (a zoom of the boxed region in Bi is shown as individual channels in Bii and Biii and Biv shown the channel merge). Foci that were pulse-labeled with biotin-dUTP had an average diameter of 0.413+/−0.087 µm (mean+/−SD; n = 100). Foci that were labeled for the entire S phase with BrdU had an average diameter of 0.414+/−0.081 µm (mean+/−SD; n = 100). Bars are 5 and 0.5 µm in low and high power images, respectively. To increase the extent of labeling in one imaging channel, foci within individual CTs were labeled with either BrdU or biotin-dUTP using the labeling scheme shown (D). Samples were fixed and processed to visualize site of incorporation by indirect immuno-labeling using secondary antibodies conjugated with Qdots™; Qdots are very stable during illumination and allowed sampling using 50 nm Z steps (92 slices in the examples shown) and multiple scans without bleaching. Individual cells were selected and confocal projections generated (E). Regions from selected cells were analyzed to identify the extent of co-localization between the two labeling channels. A 3-D reconstruction of the region highlighted in (Ei) was used for further analysis (Eii–Ev: Eii (green) and Eiii (red) show signal in the separate labeling channels; Eiv an overlay of the red and green channels and Ev a co-localization analysis using Imaris software). Note the discrete nature of the labeled sites in both labeling channels and almost complete lack of sites of overlap (yellow) in the channel merge (Eiv) – in this typical example the co-localized volume was 0.96%. Scale bars are 5 and 0.7 µm in low and high power images, respectively.

