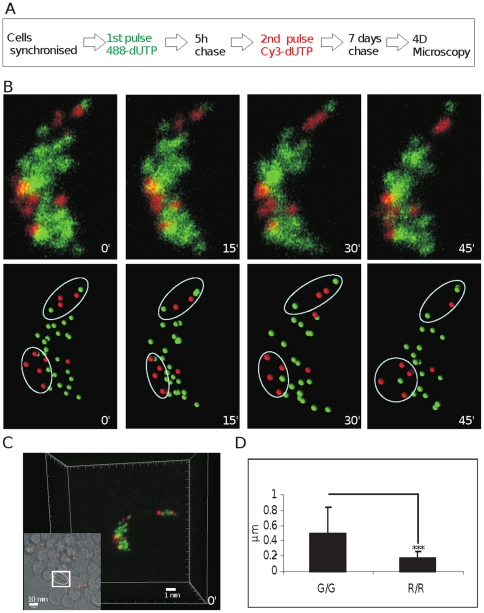
Figure 5. Differential dynamic behavior of DNA foci labeled during early and mid/late S phase.
Early replicating euchromatic foci were pulse-labeled with AF488-dUTP (green) and mid/late replicating foci with Cy3-dUTP (red) - an optimal pulse separation of 5 h was established experimentally (A). Individual CTs were resolved by mitotic segregation for 7 days (A–C) and confocal time-lapse microscopy (Zeiss LSM510META) performed over 1–2 h with sampling every 15 min. Raw images (B; upper panels) show maximum projections of Z stacks for a typical isolated CT (from the cell highlighted in C). Raw images were imported into Imaris software in order to determine the mass centers of individual labeled sites (DNA foci). Software-generated spheres (250 nm; B; lower panels), which represent the mass centers of discrete foci, were used to develop 3-D coordinates to define changes in separation of paired neighboring foci (n = 42). For each time-lapse series used (B), 4 3-D projections were generated at 15 min intervals and specific regions identified (white ovoids) where foci could be tracked without ambiguity. In each image, the separation between all neighboring pairs of assigned foci (within each ovoid) was determined. Finally, the 4 data sets were used to calculate 3 relative separations that define the change in separation of assigned foci in µm/15 min (µm in D). The relative dynamic properties shown relate to early foci within early replicating chromosomal domains (G/G) and mid/late foci within mid/late replicating domains (R/R). Scale bars of 1 and 10 µm are shown on individual panels.

