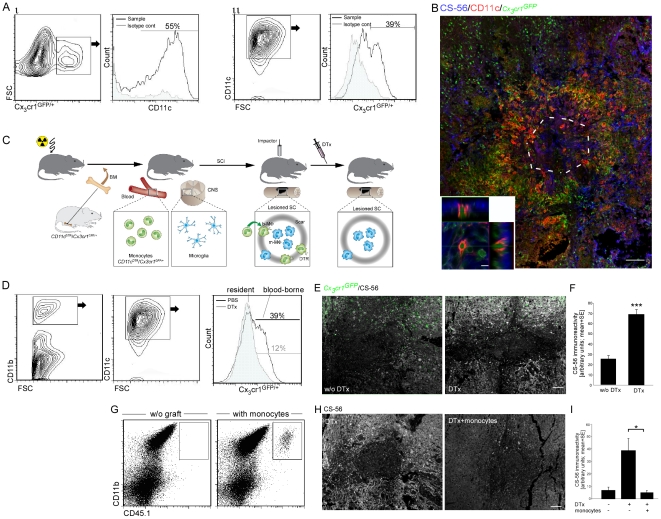
Figure 3. Infiltrating monocytes resolve glial scar matrix accumulation.
(A) Flow cytometry analysis of spinal cord tissues isolated from spinal cord injured [Cx3cr1 GFP/+>wt] BM chimeras at day 7 post trauma. The histograms were pre-gated according to the presented topography plot, following gating on CD11b+ cells. GFP and CD11c expression are approximately 50% correlated. (B) Representative confocal micrograph of longitudinal sections isolated at day 7 post injury from injured spinal cord of [Cx3cr1GFP/+>wt] BM chimeras, labeled for CS-56 (blue), GFP (green), and CD11c (red). Lower panel: z-axis projection of a single cell. (C) Schematic illustration of the experimental design: [CD11c-DTR:Cx3cr1 GFP/+>wt] BM chimeras were subjected to SCI, 8 weeks post BM transplantation; half of them received DTx. (D) Flow cytometric analysis of cells from the lesion site of DTx-treated and non-treated [CD11c-DTR: Cx3cr1 GFP/+>wt] BM chimeras, demonstrating depletion of CD11c-expressing monocytes but not of their resident counterparts, the microglia. The histograms were pre-gated according to the presented topographic plots. (E, F) Labeling of the spinal cord tissues sections, isolated at day 14 post injury, with CS-56 (white). Quantitative analysis of CSPG immunoreactivity is presented. Depletion of monocytes by DTx dramatically increased CSPG accumulation (Student's t-test; ***p = 0.0001). (G–I) Spinal cord injured [CD11c-DTR:Cx3cr1GFP/+>wt] BM chimeric mice were treated with DTx and were adoptively transferred with wt CD115+ monocytes (resistant to DTx treatment). Control groups included chimeric animals without monocyte transfer, with and without DTx treatment. (G) Flow cytometric analysis of the spinal cord lesion site with or without adoptive transfer of CD115+ monocytes (CD45.1+) following DTx treatment. (H,I) Spinal cord tissues sections, isolated at day 14 post injury, labeled with CS-56 (CSPG; white), with and without reconstitution of wt monocytes is presented in H. Quantitative analysis of CSPG immunoreactivity is presented in I. Depletion of monocytes dramatically increased CSPG accumulation, which was prevented by adoptive transfer of naïve monocytes (ANOVA; F2,10 = 5.46; p = 0.05). Scale bar: (B) 100 µm (bottom panel; 10 µm); (E,H) 50 µm. y-axis error bar represents SEM.

