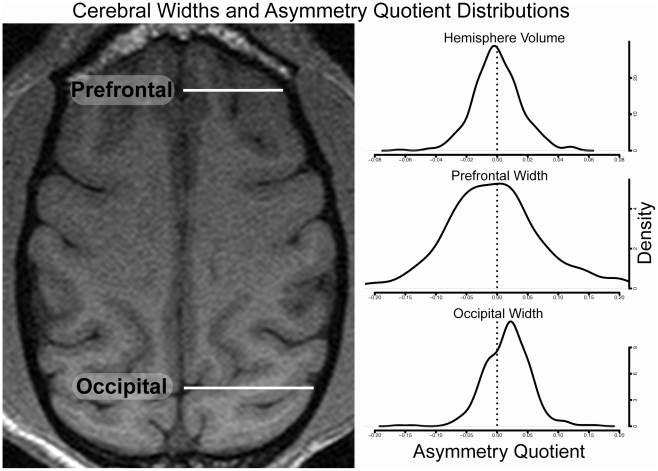
Figure 3. Cerebral Widths and Asymmetry Quotient Distributions.
Left panel shows an example of a traverse slice dorsal to the corpus callosum with cerebral widths indicated on the right hemisphere. Right panel shows the distributions of the asymmetry quotients for hemisphere volume and each cerebral width.

