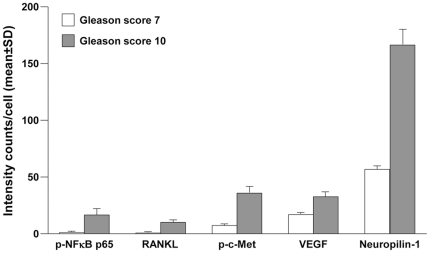
Figure 6. MQDL assesses differential gene expression in clinical primary prostate cancer specimens.
C-Met-activated and EMT protein expressions in 5,000 cells of each representative prostate cancer tissues of Gleason scores 7 (3+4) and 10 (5+5) were compared. Expression intensities were quantified with the inForm software and statistically compared (P<0.05).

