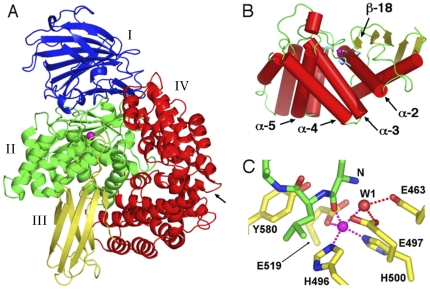
Figure 1. Structure of PfA-M1 aminopeptidase N.
A. Ribbon diagram of PfA-M1 (PDB code 3EBH) coloured by domain: I (blue), II (green), III (yellow) and IV (red). Zinc ion depicted as purple sphere. Arrow indicates position of C-terminal channel opening. B. Catalytic domain II, with α-helices coloured red, loops green and β-strands yellow. Active site residues are shown in stick form with carbon cyan, oxygen red and nitrogen blue. Zinc ion depicted as purple sphere. The N-terminal lobe consisting of a 5-stranded β-sheet and α-helices 1–2 is to the right, the C-terminal lobe comprising α-helices 3–8 is to the left. The active site occurs in the cleft between the N- and C-terminal lobes. C. Ligand-bound active site. Active site of the starting structure of the ligand-bound complex used in the simulation. Ligand and active site residues are shown in stick form with carbon green (ligand) or yellow (PfA-M1), oxygen red and nitrogen blue. The nucleophilic water is labelled “W1” and the ligand N-terminal amino nitrogen “N”. Hydrogen bonds and metallo bonds are shown as red and purple dotted lines, respectively.

