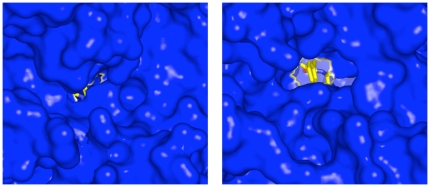
Figure 6. Opening of the N-terminal small channel.
Surface representation (blue) of the starting structure (left) and the ligand-bound structure at t = 75 ns (right). Ligand is shown in stick form with carbon yellow, oxygen red and nitrogen blue. The N-terminal phenylalanine residue of the ligand is visible in the opened channel at t = 75 ns (right).

