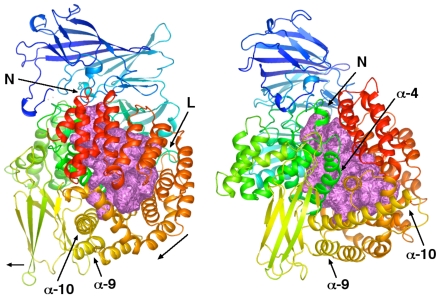
Figure 7. Propagation of conformational changes from the active site to domain III and α-helix 10.
Two roughly orthogonal views of PfA-M1 with secondary structural elements coloured in a spectrum pattern, blue to red, according to residue number. The internal chamber within the protein is shown in space filling representation and coloured violet. N-terminal channel indicated by an “N”. Left panel: Loop between β-strand 19 and α-helix 2 in domain II indicated by “L”. α-helices 11–19 are coloured orange through yellow and appear in the lower right quadrant. This region rotates in the direction of the oblique arrow. Domain III (lower left) moves in the direction of the small horizontal arrow. Right panel: α-helix 4 from domain II moves down and to the right, impinging on α-helix 10 at its N-terminus and also via α-helix 13.

