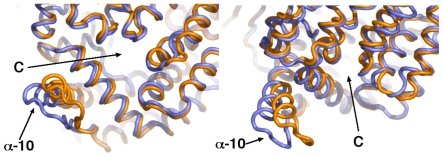
Figure 8. Concerted motions of the α-helix 10 C-terminal arm toward the large C-terminal channel.
Two views of the overlayed maximum (orange) and minimum (slate) projection structures of PCA eigenvector 2 from the simulation of the ligand-bound complex. Opening to the C-terminal channel indicated by a “C”.

