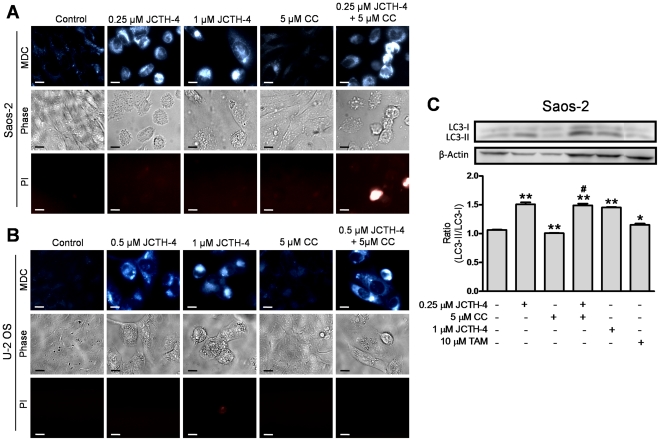
Figure 11. JCTH-4 induces autophagy in OS cells alone and with CC.
The presence of autophagic vacuoles in (A) Saos-2 after 96 hours of treatment and (B) U-2 OS cells after 72 hours of treatment with JCTH-4, CC, and solvent control (Me2SO) was determined by MDC staining. Bright blue punctate marks are indicative of autophagic vacuoles. Corresponding phase and PI micrographs are shown below the MDC images. Scale bar = 15 µm. All images are representative of 3 independent experiments. (C) Cell lysates of Saos-2 cells treated with JCTH-4, CC, TAM as positive control, and solvent control (Me2SO) for 72 hours were examined for the conversion of LC3-I to LC3-II by western blot analyses. β-actin was probed to serve as a loading control. Densitometric analyses were done using ImageJ software and statistics were calculated using GraphPad Prism version 5.0. Image is representative of 3 independent experiments demonstrating similar trends. Values are expressed as mean ± SD of triplicates of one independent experiment. *p<0.05, **p<0.01 versus solvent control (Me2SO); #p<0.01 versus 5 µM CC.

