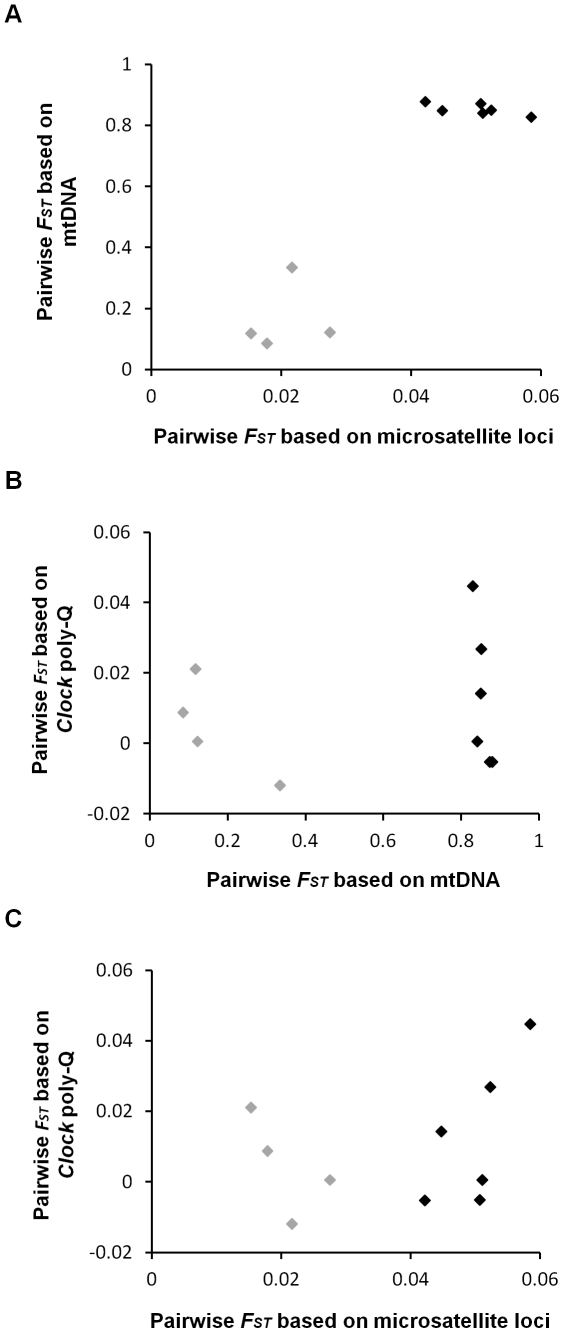
Figure 2. Between-populations pairwise genetic differentiation values (FST) comparisons.
(A) Comparisons between mitochondrial haplotypes and microsatellite loci, (B) between Clock poly-Q locus and mitochondrial haplotypes and (C) between Clock poly-Q locus and microsatellite loci. Points in black represent comparisons between the erythrogaster subspecies to either the rustica or transitiva subspecies, while points in grey represent comparison within the erythrogaster subspecies and between the rustica and transitiva subspecies (which are mitochondrially intermixed).

