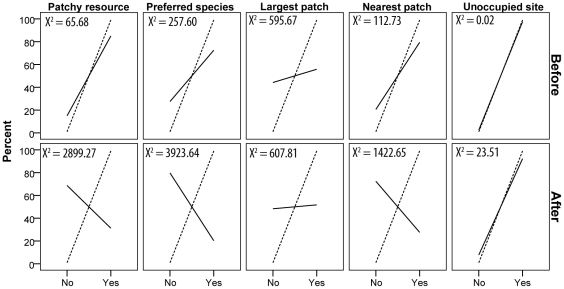
Figure 5. Comparison of observed (solid line) and expected (dashed line) frequency of resource use before and after habitat removal, with results from the chi-square goodness of fit test.
Models tested were those that address whether bats used 1) a patchy roosting resource, 2) their preferred plant species (H. imbricata), 3) the largest patch in the area, 4) the patch closest to the group's core home range, and 5) a roost located in a site that was not occupied by another group.

