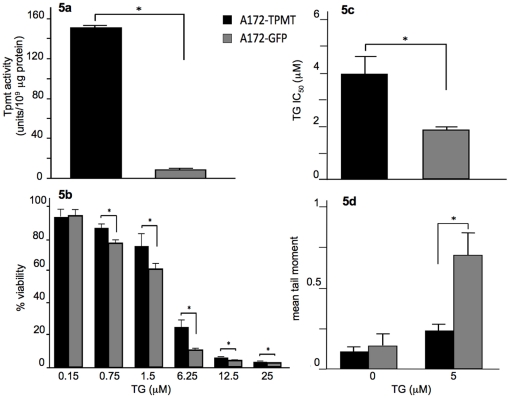
Figure 5. Comparison of Tpmt-associated phenotypes in A172 isogenic cells.
Tpmt protein activity was measured in A172mock and A172Tpmt cell lines. (a) Tpmt protein activity was significantly higher in A172Tpmt (p<0.05); additionally, (b) A172Tpmt showed a significantly higher resistance to TG-induced toxicity when compared to A172mock as determined by the MTT cell viability data (p<0.005) and (c) by IC50 values (p<0.05). (d) The alkaline comet assay was used to compare TG-induced DNA damage. A172mock displayed a significantly higher DNA damage than A172Tpmt (p = 0.03) as measured by mean comet tail moment. Bars represent the means; whiskers represent the standard deviation (±). * p<0.05.

