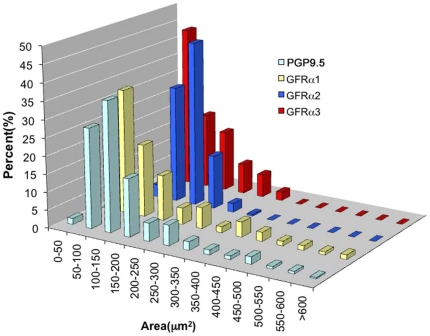
Figure 2. Cell size distribution of PGP9.5-, GFRα1-, GFRα2- and GFRα3-positive neurons in L4-5 DRG.
Neurons were sorted by their cell area and the percent of neurons within each 50 µm bin were plotted. PGP9.5 staining was used to obtain the distribution for all sensory neurons. Note that GFRα1-immunoreactivity was expressed in both small and large sized neurons. Most GFRα2-positive neurons had areas between 100–250 µm2 whereas over 70% of GFRα3-positive neurons had areas of <200 µm2.

