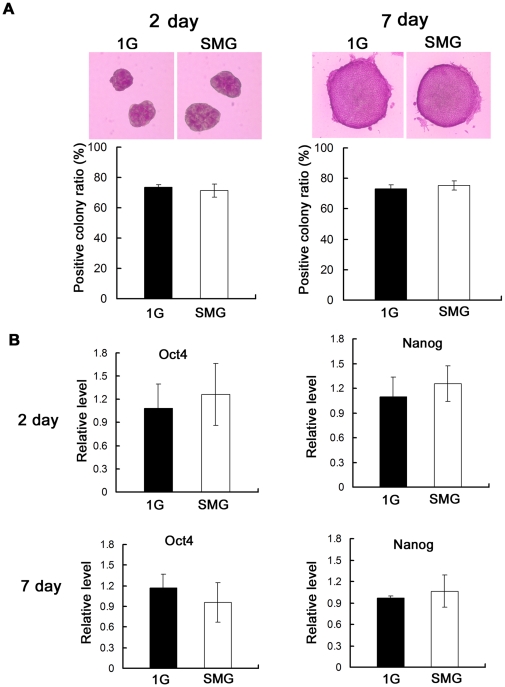
Figure 1. Differentiation state of mES cells after incubation under SMG or 1G.
(A) Upper: Representative microphotographs of mES cells of group 1G and group SMG after ALP staining on Day 2 and Day 7, taken at 100× and 200× magnification respectively. Lower: Percentages of ALP-positive colonies on Day 2 and Day 7. More than 50 colonies of each group were checked for the calculation of the positive colony ratio. (B) Evaluation of the relative expression level of Oct4 and Nanog by quantitative real-time PCR on Day 2 and Day 7. Oct4 and Nanog are extensively used pluripotency markers of stem cells. The data represents mean ± SD of three independent experiments.

