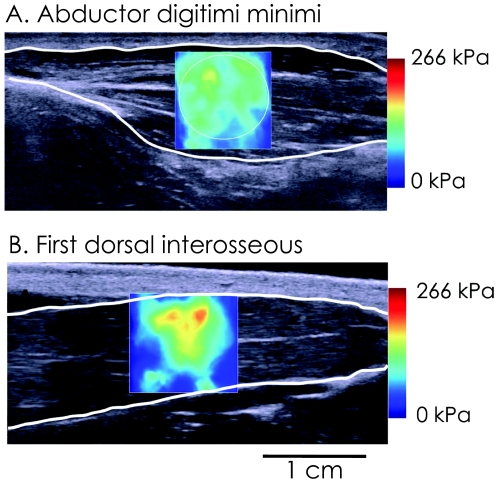
Figure 2. Typical example of shear elastic modulus measurement of the abductor digiti minimi (A) and the first dorsal interosseous (B).
These data were obtained in a representative subject during the “ramp contraction”. The colored region represents the shear elasticity map with the scale to the right of the figure. The shear elastic modulus (in kPa) was averaged over the greatest muscular area avoiding aponeurosis.

