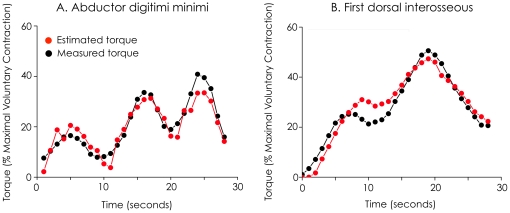
Figure 4. Typicalexample of torque estimation using supersonic shear imaging.
Shear elastic modulus and torque (black dots/lines) measurements were obtained during “random changes contraction”. Torque estimation (red or grey dots/lines) was performed using the equation of the linear regression obtained for “ramp contraction” (Eq 2 in the manuscript). Torque measurements and torque estimations are depicted for both the abductor digiti minimi (A) and the first dorsal interosseous (B).

