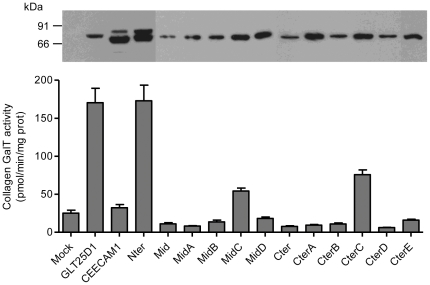
Figure 3. ColGalT activity of GLT25D1, CEECAM1 and chimeric constructs.
Values represent the mean and S.E.M. of at least four independent assays per construct. The mock sample indicates the activity measured in Sf9 cells infected with an empty baculovirus. The protein expression of each construct is shown at the top of each bar as performed by Western blotting using an anti-Flag tag antibody.

