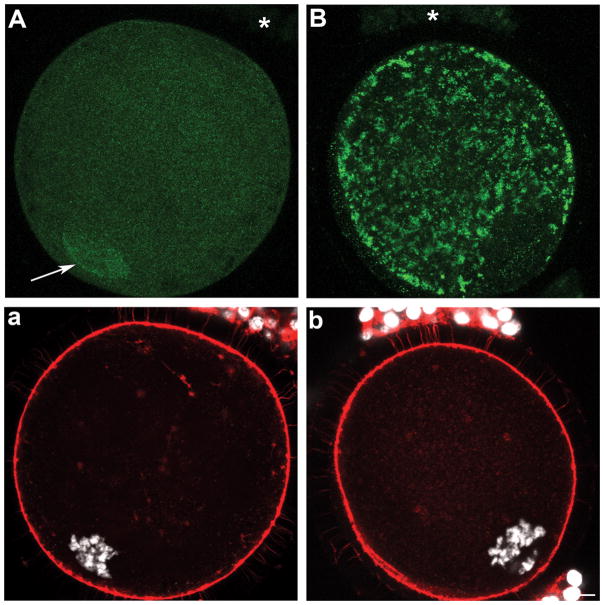
Figure 4.
Expression and localization of SOD1 (A) and SOD2 (B) in oocytes and cumulus cells upon isolation from sized antral follicles. Panels a and b show corresponding DNA (white) and microfilaments (red). (A) A fine punctuate SOD1 labelling was localized throughout the ooplasm and nucleoplasm in oocytes from small, medium, and large antral follicles with an enhanced nuclear accumulation indicated by the arrow. SOD1 was not detectable in cumulus cells (A, asterisk). (B) SOD2 was restricted to the ooplasm of oocytes from small, medium, and large follicles, with a detectable but much reduced labelling in cumulus cells (asterisk). (b) Scale bar for all panels: 10 μm.

