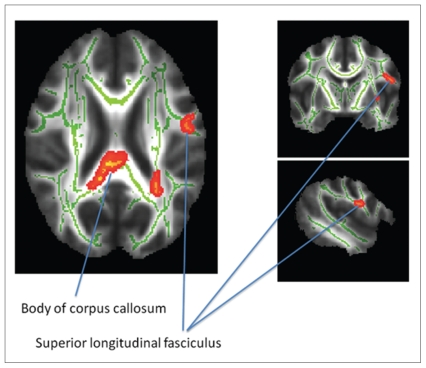
Fig. 1.
Comparison of fractional anisotropy in fibre tracts between UHRs and healthy controls. We found increased fractional anisotropy values in the posterior body of the corpus callosum (MNI coordinates x, y, z = 9, −30, 24) with extensions of the cluster into the splenium and the superior longitudinal fasciculus (MNI coordinates x, y, z = −48, −6, 21) in UHRs compared with controls (see also Table 2). Significant areas are highlighted in red–yellow (corrected for multiple comparisons) and displayed in radiologic convention: left is right and right is left. Tract names are derived from ICBM-DTI-81 white-matter labels and tractography atlas.39 MNI = Montreal Neurological Institute; UHR = unaffected first-degree relatives of patients with confirmed major depressive disorder.

