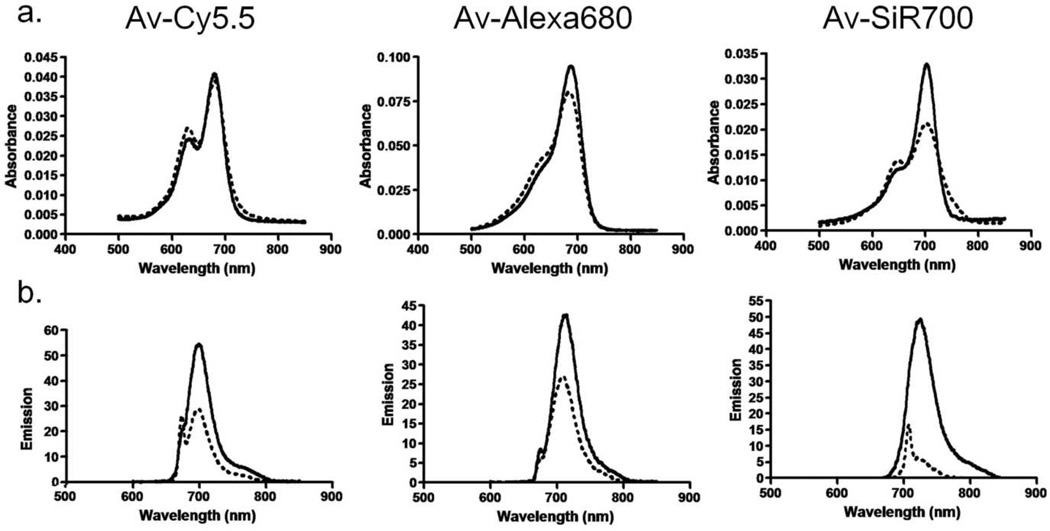
Figure 2.
(a) Absorbance spectra of NIR imaging probes, consisting of a NIR fluorophore conjugated to avidin, without SDS (dashed line) and with SDS (solid line). The blue shifted peak on the Av-Cy5.5 and Av-SiR700 curves without SDS represents H-dimer formation. Av-Alexa 680 does not demonstrate H-dimer formation. Following SDS treatment, an increase in Av-SiR700 monomer peak is characteristic of dissociation of xanthene dimers forming excitons. (b) Emission spectra of NIR imaging probes without (dashed line) and with (solid line) SDS. Emission is increased following SDS treatment for all fluorophores; however, Av-SiR700 demonstrates the greatest increase in emission following SDS.

