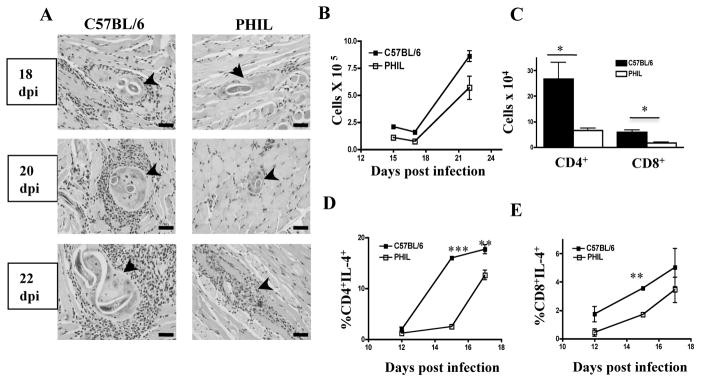
Fig. 2. Leukocyte accumulation and T cell responses in the absence of eosinophils.
(A) H&E stained sections of tongues collected from infected WT and PHIL mice. Arrows indicate nurse cells. (B) Number of leukocytes recovered from diaphragms of infected PHIL and WT mice. (C) Numbers of CD4+ and CD8+ T cells recovered from diaphragms of infected PHIL and WT mice at 15dpi and (D, E) frequency of IL-4 production by these cells 12–17 dpi. Surface phenotype and cytoplasmic cytokines wereassayed by flow cytometry. Experiments were performed two or three times with similar results. Values represent means+/− SD, n = 3 - 4 mice. Significant differences were determined by Student’s t test. *p<0.05; ** p < 0.001; ***p<0.0001.

