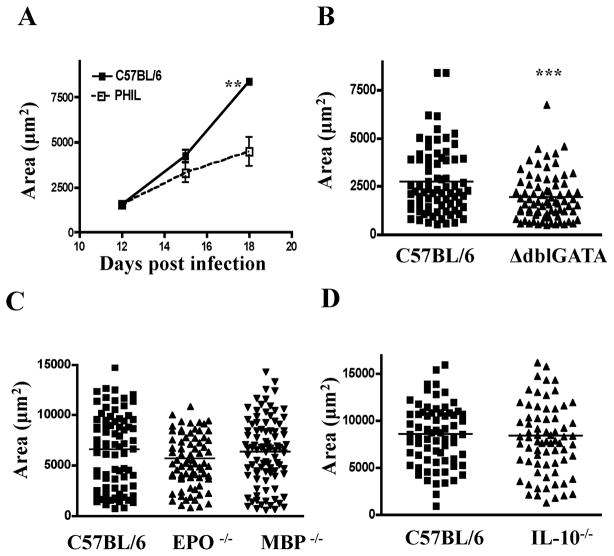
Fig. 5. Larval growth in eosinophil-ablated mice.
Estimated area of larvae recovered from(A) PHIL and WT mice between 12 and 18 dpi, (B) ΔdblGATA and WT mice 17dpi, (C) EPO−/−, MBP−/− and WTmice 18dpi, (D) IL-10 −/− and WT mice 18dpi. 25–30 larvae were evaluated per mouse. Values represent means +/− SD, n = 3 – 4 mice in A. Bars indicate the mean values from 75–90 larvae pooled from 3 mice in B, C and D. Experiments were performed two to four times with similar results. Significant differences were determined by Student’s t test (A, B, D) or by ANOVA and Tukey’s test (C). ** p < 0.001, *** p<0.0001.

