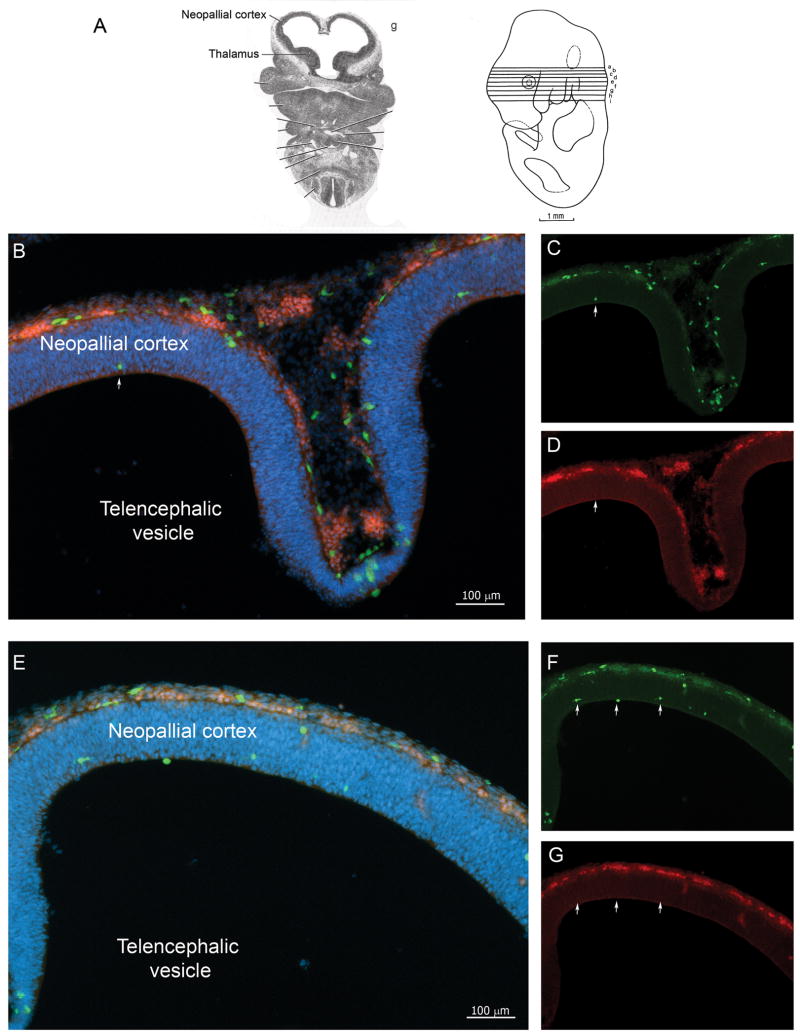
FIGURE 4. Distribution of cells in Ccr2+/RFP/Cx3cr1+/GFP E11.5 tissues.
(A) Shows the plane of section in schematic form. (B-G) Confocal images of free-floating 30um cross-sections of E11.5 tissues counterstained with DAPI (B and E, merged imaged, DAPI;blue) show CX3CR1+/CCR2+ double positive cells in the surface ectoderm (C and F, CX3CR1-GFP;green) and (D and G, CCR-RFP; red). Developing amoeboid microglia appear CX3CR1bright and localized in deep layers of neuroepithelium (arrows).

