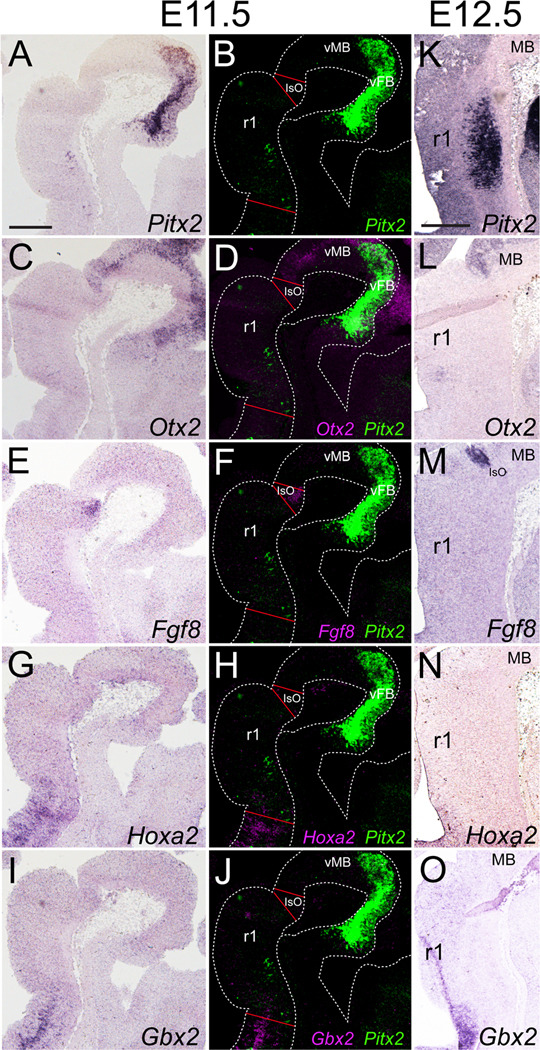
Figure 1. Pitx2-expressing cells localize to rhombomere 1.
E11.5 (A–J) or E12.5 (K–O) sagittal sections processed for (A, K) Pitx2, (C, L) Otx2, (E, M) Fgf8, (G, N) Hoxa2, or (I, O) Gbx2 single in situ hybridization. Pseudocolored and merged images of neighboring slides processed for in situ hybridization to detect mRNA for Pitx2 and either Otx2 (D), Fgf8 (F), Hoxa2 (H), or Gbx2 (J). Scale bars in A and K are 250 µm and apply to panels A–J and K–O, respectively.

