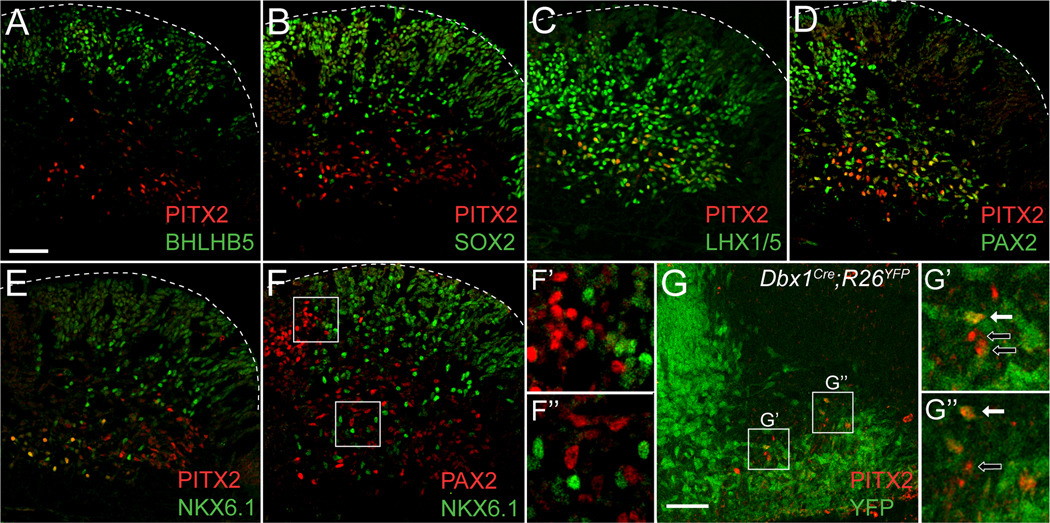
Figure 5. Early expression of PITX2 is similar to E12.5 patterning and includes Dbx1-lineage cells.
Immunolabeling of E11.5 (A–G”) Pitx2+/+ or Dbx1Cre;R26YFP embryos sectioned transversely at the level of r1 (orientated as in Figure 4A). (A–E) E11.5 PITX2-positive cells in r1 are negative for BHLHB5, some are SOX2-positive, and many are positive for LHX1/5, PAX2, and NKX6.1. (F–F”) In the E11.5 r1, PAX2 and NKX6.1 mark separate cell populations. (G–G”) Many PITX2-positive cells are YFP-positive, although some are negative. Insets in F and G are enlarged in F’/F” and G’/G”, respectively. G’ and G” show double (solid arrow) or single (open arrow) labeled cells. Scale bar in A is 50 µm and applies to panels A–F. Scale bar in G is 50 µm. All immunofluorescent images were taken using confocal microscopy.

