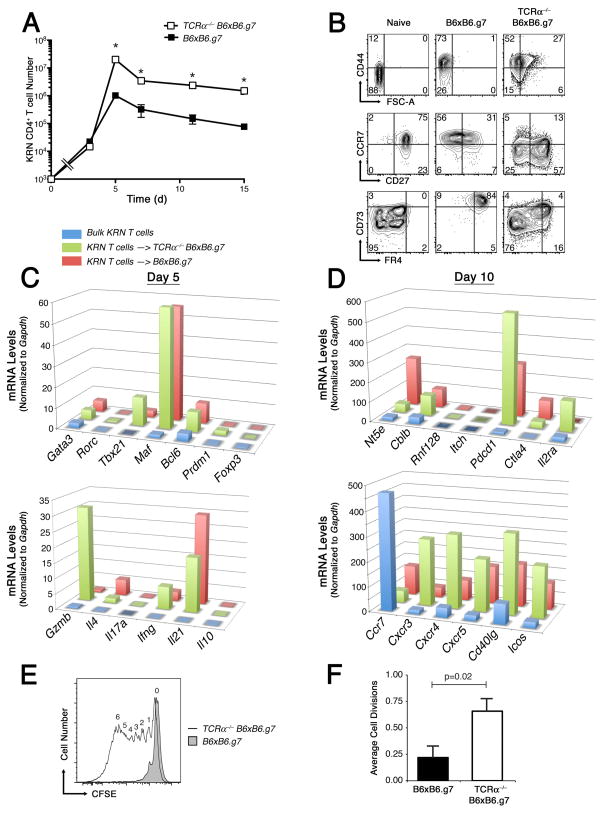
Figure 3.
KRN CD4+ T cell number, phenotype, and function following adoptive transfer into WT or TCRα−/− B6×B6.g7 hosts. A, Mean ±SEM KRN CD4+ T cell number in combined spleen and lymph nodes from WT B6×B6.g7 (■) and TCRα−/− B6×B6.g7 (□) recipients. The open square at T = 0 represents historical post-adoptive transfer cell count; asterisks indicate significant differences between groups (P < 0.05). B, KRN CD4+ T cell FSc, CD44, CCR7, CD27, FR4 and CD73 expression at day 10. Plots are representative of greater than 6 animals per group. C,D, Purified KRN T cell mRNA expression levels on days 5 (C) and 10 (D) after adoptive transfer into either WT (red) or TCRα−/− (green) B6×B6.g7 hosts. Freshly isolated naïve KRN T cells are also shown as a control (blue). E, Purified KRN CD4+ T cells were exposed for 7 days to GPI/I-Ag7 in WT (shaded tracing) or TCRα−/− (open tracing) B6×B6.g7 hosts, recovered and labeled with CFSE, and then examined for CFSE dye–dilution 3 d after adoptive transfer into B6×B6.g7 secondary hosts. Digits above the tracing indicate the number of times a cell has divided. F, Average cell division rate ±SEM (n = 7) for groups as indicated. P values based on Student’s t test.

