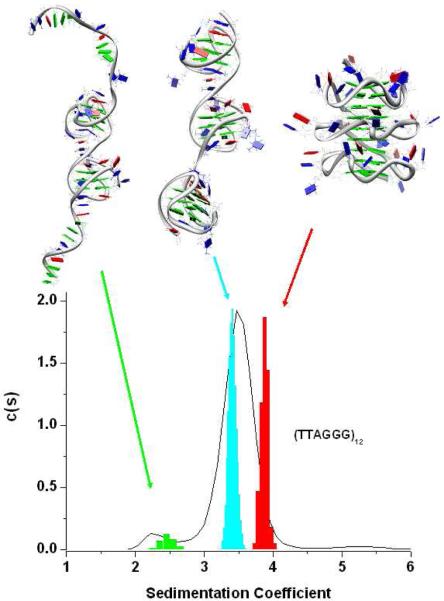
Figure 2.
The average structure of the Hybrid-121, all-propeller and dt12 models are shown on the (top). The colors of the residues are: green for dG, blue for dT and red for dA residues. On the bottom of the figure, the sedimentation coefficient distributions obtained from the MD trajectories of the model (indicated by the colored arrows) are superimposed on the experimental distribution (black line) obtained for the (TTAGGG)12 telomeric sequence in K+ solution.

